Super-Paramagnetic Clustering (SPC)
In our previous posts, we explored the Ising Model and the
Today, we take a leap from pure physics into machine learning. What happens if we replace the rigid lattice with a graph derived from data?
This leads us to Super-Paramagnetic Clustering (SPC), a method that uses the thermodynamics of the Potts model to naturally discover structures in data without needing to specify the number of clusters beforehand.
From Lattices to Data Graphs
In the standard Potts model, spins interact only with their fixed neighbors on a grid, and the interaction strength
Crucially, the interaction strength is no longer constant. It becomes a variable
This creates a physical system where “friends” (nearby points) have strong bonds, while “strangers” (distant points) have weak bonds.
The Three Phases of Data
When we simulate this system using the Swendsen-Wang algorithm, we observe three distinct phases as we sweep the temperature
- Ferromagnetic Phase (Low T): The system is frozen. All bonds are active, and the entire dataset looks like one giant cluster. (Useful only for outlier detection).
- Paramagnetic Phase (High T): The system is melted. Thermal noise breaks all bonds, and every data point becomes its own tiny cluster.
- Super-Paramagnetic Phase (Intermediate T): This is the sweet spot. The thermal energy is high enough to break the weak links between natural groups, but low enough that the strong links within groups remain intact.
In this phase, the “clusters” identified by the Swendsen-Wang algorithm correspond exactly to the natural clusters in your data.
Results: Solving Topological Problems
We tested this method on two challenging toy datasets. The dashboards below show the cluster evolution (top row) and the thermodynamic observables (bottom row).
Case 1: Concentric Circles (Topology)
Standard algorithms like K-Means assume clusters are globular “blobs” and fail spectacularly on rings, usually slicing them in half.
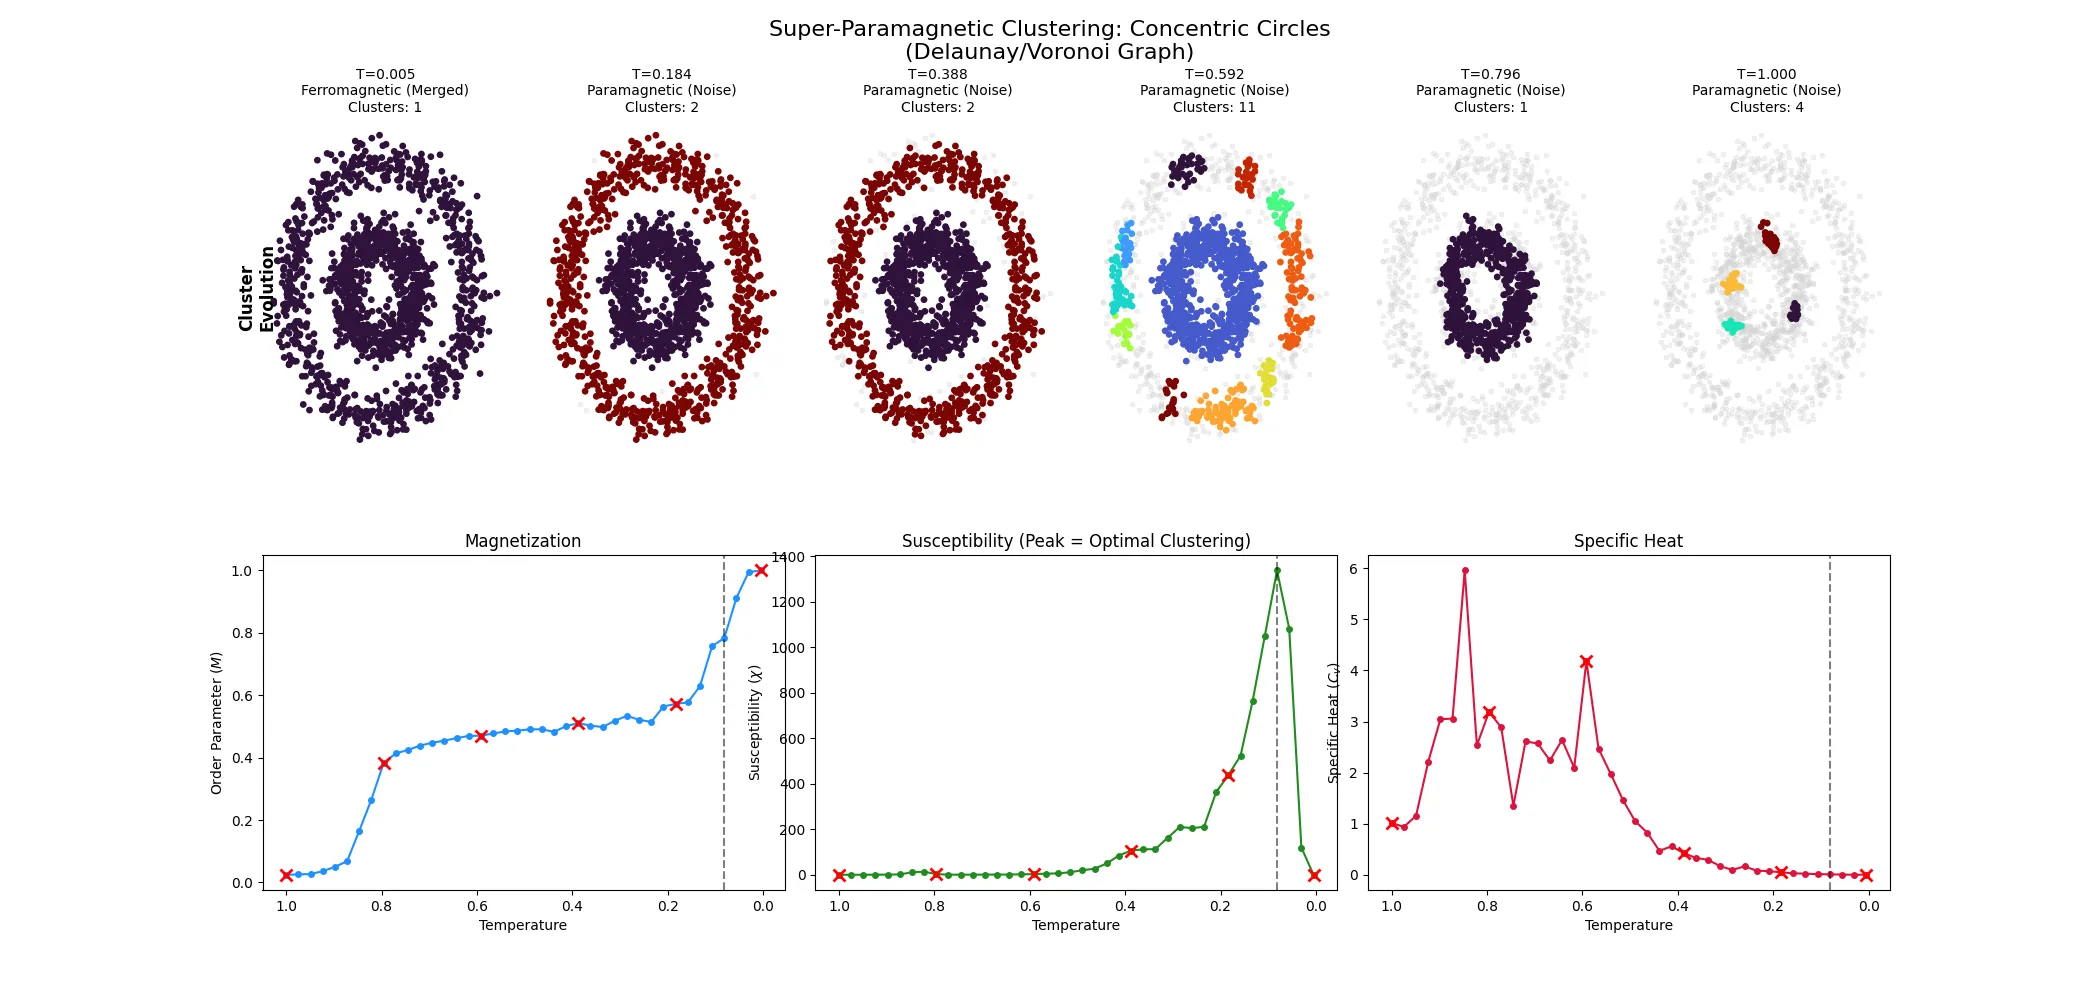
The Result: At the critical temperature (
The Signal: Look at the Susceptibility (
Case 2: High-Dimensional Blobs
We also generated clusters in 10-dimensional space and projected them to 2D for graph construction (using PCA-based Delaunay triangulation).
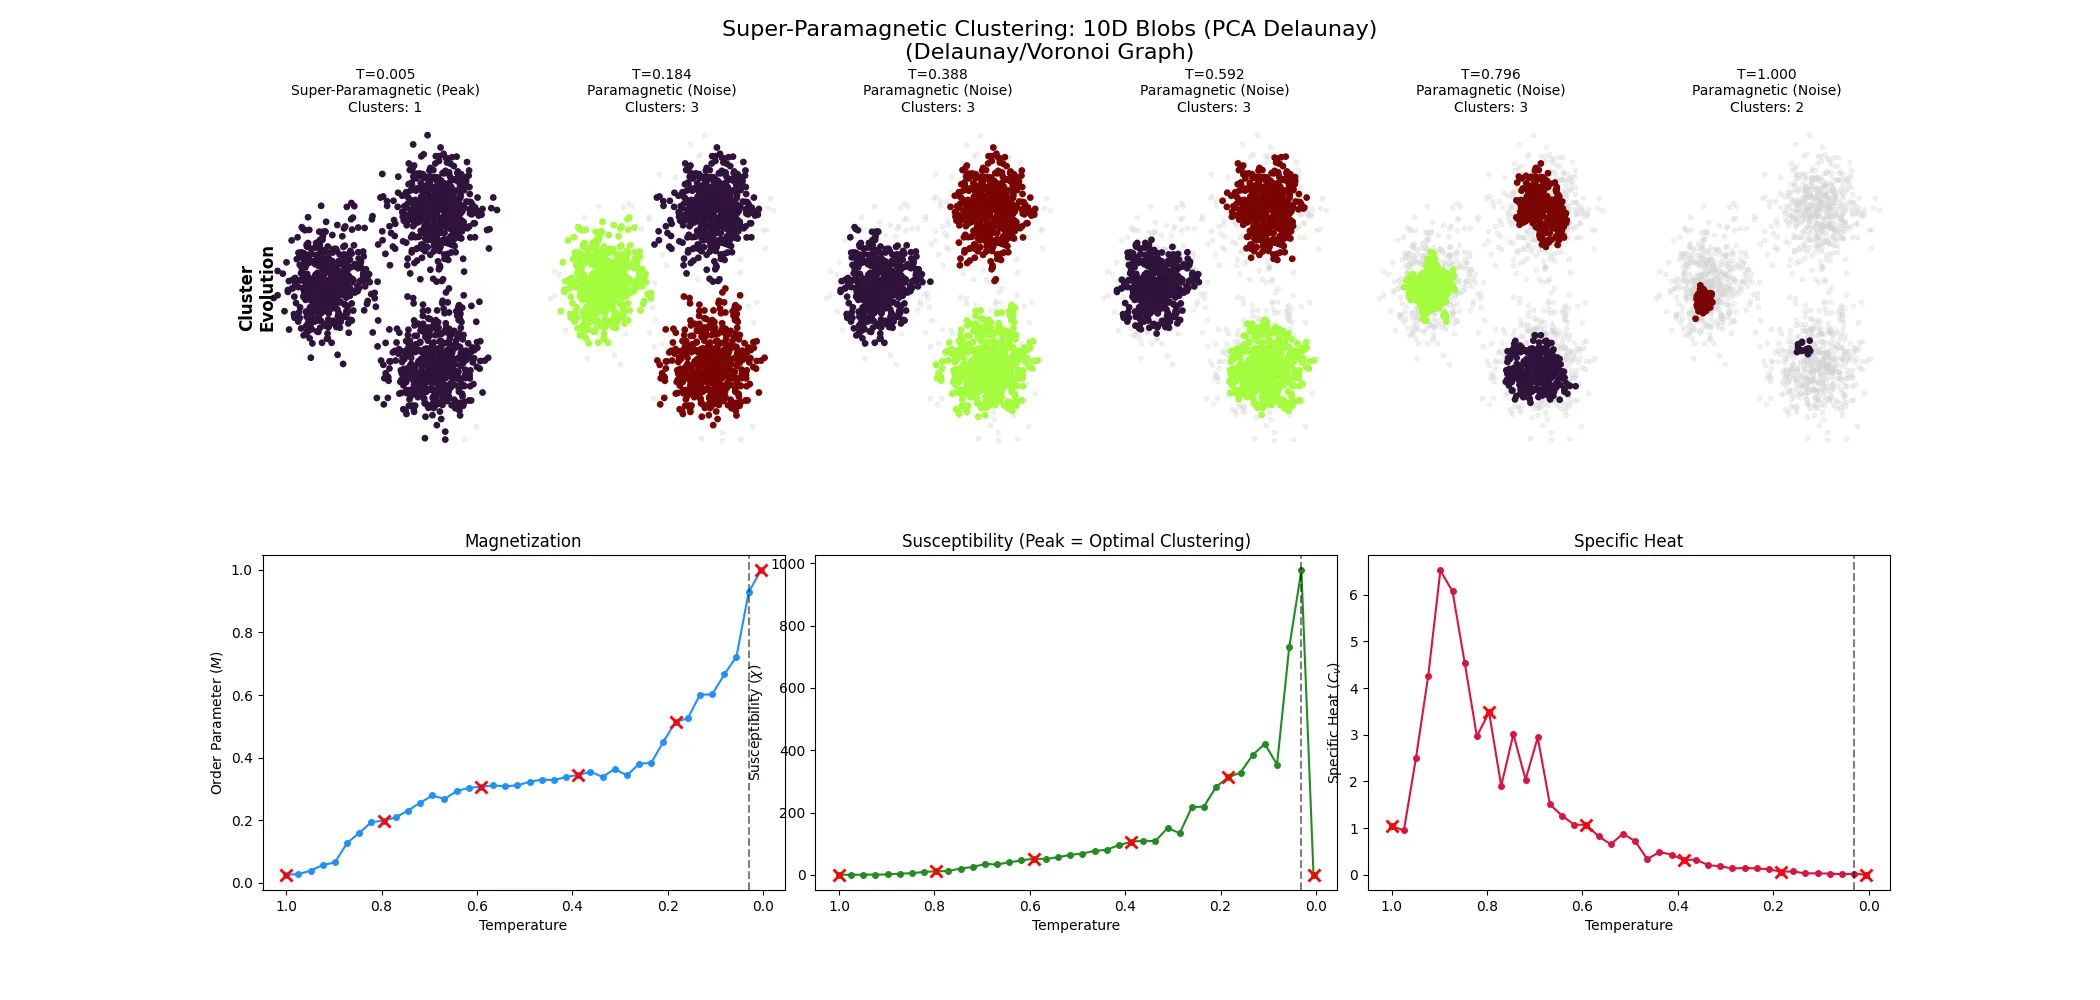
The Result: The method cleanly recovers the three distinct groups. Notably, the gray points in the snapshots represent “paramagnetic” nodes—points that fluctuate too wildly to belong to any stable core. This highlights a hidden feature of SPC: it performs automatic outlier detection, isolating noise points that don’t fit well into any cluster.
Conclusion
By adapting the Potts model to data-derived graphs, we transform a statistical mechanics simulation into a robust clustering algorithm. It trades the difficulty of choosing ‘